
RomeoSEO11 min read
SEO Benchmarks 2026: CTR, Rankings, and Traffic
Real 2026 SEO benchmark numbers for CTR by position, ranking gains, and traffic growth, why the studies disagree, and how to build your own from Search Console.
Summary of the Article
SEO benchmarks are reference numbers for judging your own performance: click-through rate by position, what ranking gains are worth, and how fast organic traffic should grow. There is no single correct number for any of them. Published studies disagree a lot in 2026, mostly because AI answers changed how people click.
- CTR by position: First Page Sage's September 2026 report puts blended position 1 CTR at 7.1% when an AI answer is on the page and 22.6% when it is not. Other studies range roughly 8 to 40% for position 1, so treat any single figure with suspicion.
- Ranking gains: movement below position 5 barely registers. On a keyword with 1,000 monthly searches, climbing from position 9 to 6 adds about 4 clicks a month. The real gains start around the top 5.
- Traffic growth: one third-party industry table lands around +5% to +20% per year depending on vertical. Treat it as a rough aggregate, not a target.
- The most useful benchmark is your own Search Console history, compared over fixed, matching date windows.
This guide gives you the published numbers, explains why the studies fight with each other, and then shows how to build a benchmark from your own data before you spend money on any tool.
CTR by position: the 2026 numbers
The most-cited fresh source is First Page Sage's 2026 CTR report, updated September 22, 2026. It draws on 1,184 domains, 3.67 billion impressions, and 41.2 million clicks between March and August 2026. Because AI answers now change click behavior so much, the report splits every position three ways.
| Organic position | AI answer present | No AI answer | Blended (US) |
|---|---|---|---|
| 1 | 3.6% | 22.6% | 7.1% |
| 2 | 1.4% | 10.2% | 3.0% |
| 3 | 0.8% | 5.8% | 1.7% |
| 4 | 0.5% | 3.7% | 1.1% |
| 5 | 0.3% | 2.5% | 0.7% |
| 6 | 0.3% | 1.8% | 0.6% |
| 7 | 0.2% | 1.3% | 0.4% |
| 8 | 0.2% | 0.9% | 0.3% |
| 9 | 0.1% | 0.7% | 0.2% |
| 10 | 0.1% | 0.5% | 0.2% |
Two honest caveats before you copy these numbers into a forecast:
- The data is US-weighted and comes from a client Search Console panel, so it skews toward sites that already do SEO work.
- Older and other studies put position 1 anywhere from about 8% to 40%. The divergence is real, not noise. We explain why in the next section.
Why published CTR studies disagree
If one report says position 1 gets 39.8% of clicks and a newer one says 7.1%, somebody is not lying. They are just measuring different things. Four settings change the answer:
- Methodology. First Page Sage uses its own client Search Console panel. Ahrefs uses hundreds of thousands of anonymized GSC properties. An agency's client mix looks nothing like a random sample of the web.
- SERP features. A "position 1" under an AI Overview, above a local pack, or squeezed under ads is not the same position on three different pages.
- Device and market. Mobile SERPs show bigger AI answer blocks, so mobile CTR is lower. US-weighted data does not transfer to other countries.
- Query intent. Informational queries get AI answers far more often than transactional ones, so the same rank earns different CTR depending on what people were asking.
The practical rule: never lift a number without its settings. A benchmark without a methodology note is a guess wearing a suit.
How AI answers broke the old benchmarks
First Page Sage reports that AI-generated answers now appear on 81.6% of US queries as of September 2026, up from 23.4% a year earlier, and above 94% on informational and commercial-research queries. The same report states that in July 2026, Google made its AI-generated answer the default response to a search rather than an optional layer. Treat that last part as the study's framing, not settled fact: Google has said publicly that AI Mode is not the default experience in Search, and its VP of Search Engineering denied plans to make AI Mode the default in Chrome. Whatever the exact mechanism, the measured click shift is real and large.
Three consequences for your benchmarks:
- Position 1 lost most of its value. The same report measures an 82% year-over-year drop in blended position 1 CTR, from 39.8% to 7.1%. On pages with an AI answer, ranking first is worth 84% less than on pages without one.
- The bottom of page 1 flatlined. Positions 8 through 10 now perform within a rounding error of each other. Chasing position 9 into position 8 is, in traffic terms, chasing nothing.
- Citation clicks became a real destination. When Google cites your page inside an AI answer, the first cited source earns 5.2% CTR in the same study, which beats the 3.6% for the top organic result on those pages. Fewer than four in ten cited URLs also rank in the organic top 10, so citations and rankings are now separate games.
If you track AI visibility separately from rankings, our guide on AI search monitoring covers how to do that.
Ranking benchmarks: which position gains actually pay
The old advice was that every position gain adds traffic. The 2026 curve says otherwise. Below position 5, the blended CTRs in the table above sit between 0.2% and 0.6%. That means:
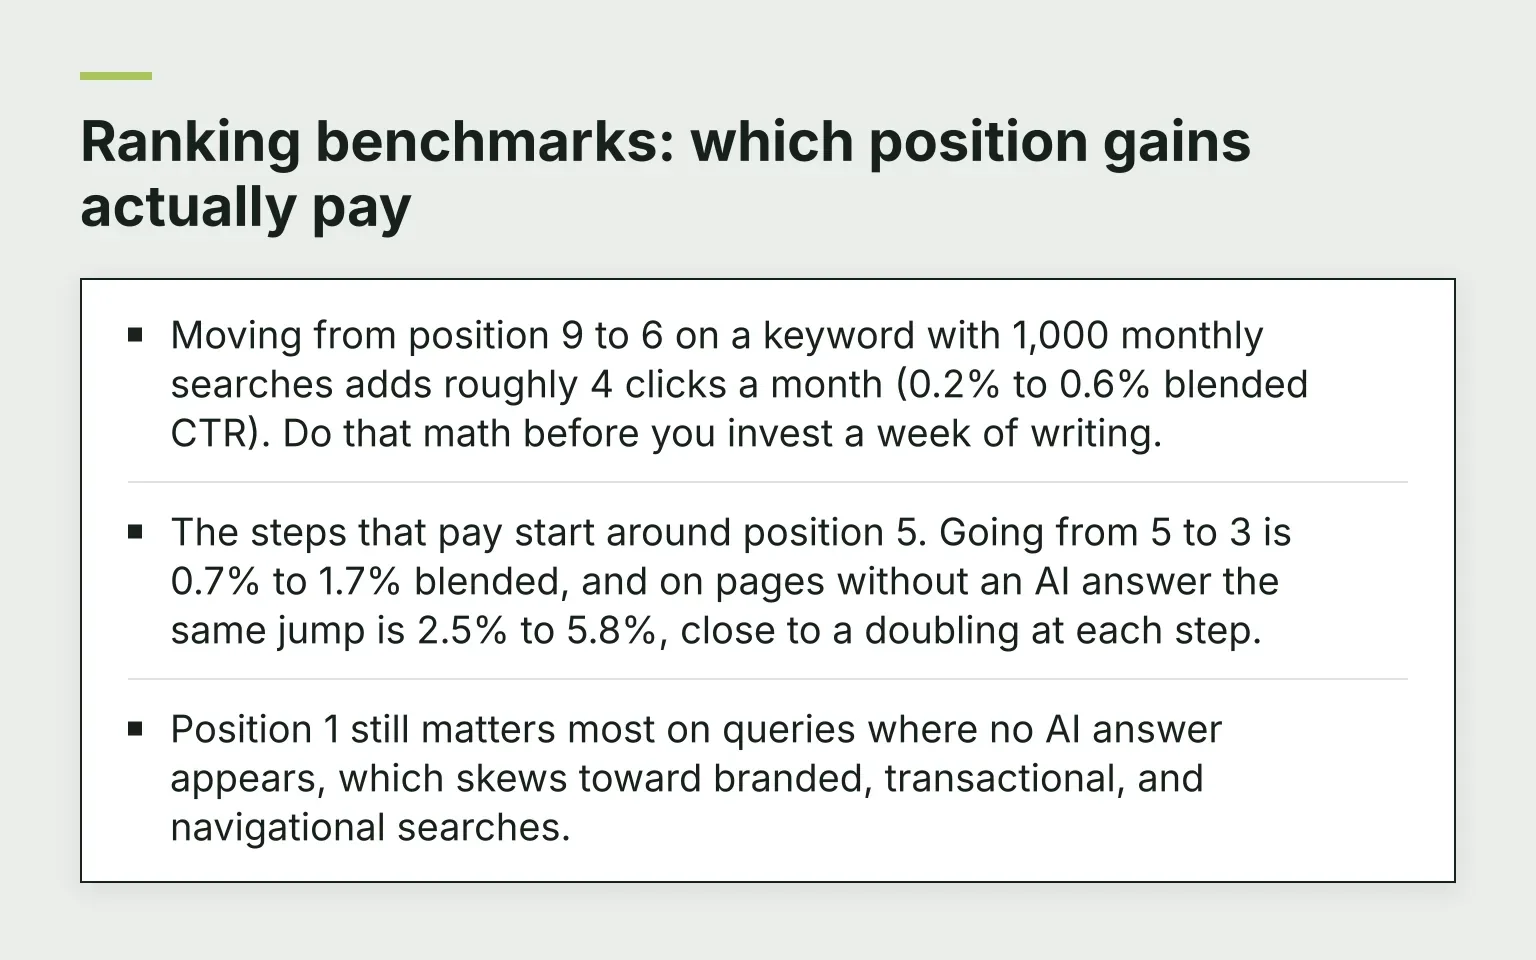
- Moving from position 9 to 6 on a keyword with 1,000 monthly searches adds roughly 4 clicks a month (0.2% to 0.6% blended CTR). Do that math before you invest a week of writing.
- The steps that pay start around position 5. Going from 5 to 3 is 0.7% to 1.7% blended, and on pages without an AI answer the same jump is 2.5% to 5.8%, close to a doubling at each step.
- Position 1 still matters most on queries where no AI answer appears, which skews toward branded, transactional, and navigational searches.
So a realistic benchmark for ranking work is not "move up one position." It is "get the pages that matter into the top 5, and get cited in AI answers where you cannot."
How fast should movement happen? New pages on an established site often take weeks to months to reach their sustainable position, and new sites take longer because authority compounds over time. For a deeper walk-through of tracking movement over time, see our guide to SEO keyword ranking and the Search Console ranking walkthrough.
Organic traffic growth benchmarks by industry
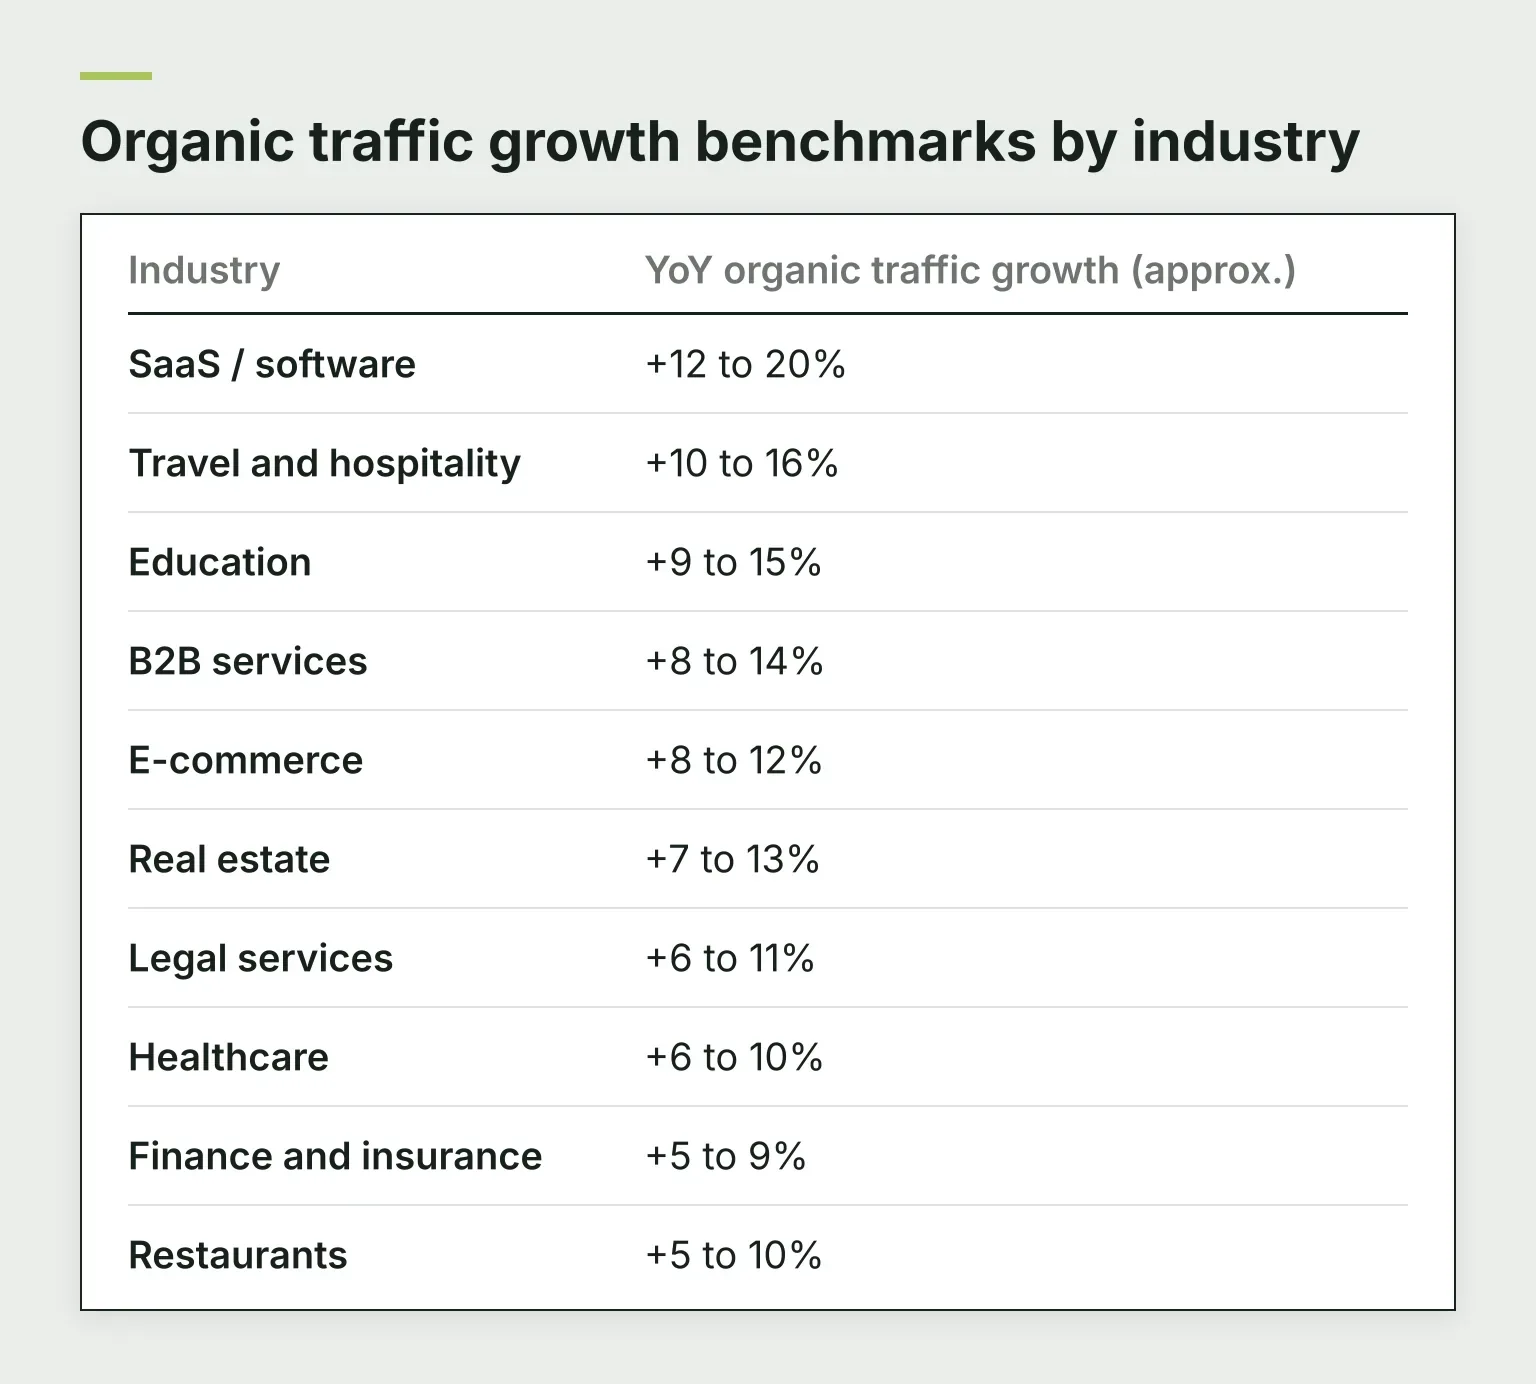
For year-over-year growth, the honest answer is a range, not a number. MetricNexus' 2026 industry tables, compiled from aggregated Semrush, Ahrefs, BrightEdge, and published report data, put YoY organic traffic growth roughly between +5% and +20% depending on vertical:
| Industry | YoY organic traffic growth (approx.) |
|---|---|
| SaaS / software | +12 to 20% |
| Travel and hospitality | +10 to 16% |
| Education | +9 to 15% |
| B2B services | +8 to 14% |
| E-commerce | +8 to 12% |
| Real estate | +7 to 13% |
| Legal services | +6 to 11% |
| Healthcare | +6 to 10% |
| Finance and insurance | +5 to 9% |
| Restaurants | +5 to 10% |
Treat all of these as directional. MetricNexus itself flags that the spread within a vertical is usually wider than the gap between verticals, that some verticals have thin data, and that the numbers are US-centric. A flat year in a shrinking niche can be a win. A +10% year in a hot category can be a loss.
Site-level traffic medians: the Ahrefs reference
For "how much traffic should a site like mine get," the best public dataset is Ahrefs' organic traffic benchmarks, built from anonymized Search Console data for 344,956 real websites and updated monthly. It reports medians, not averages, because a few giant sites would otherwise pull the average into the millions.
The key rows:
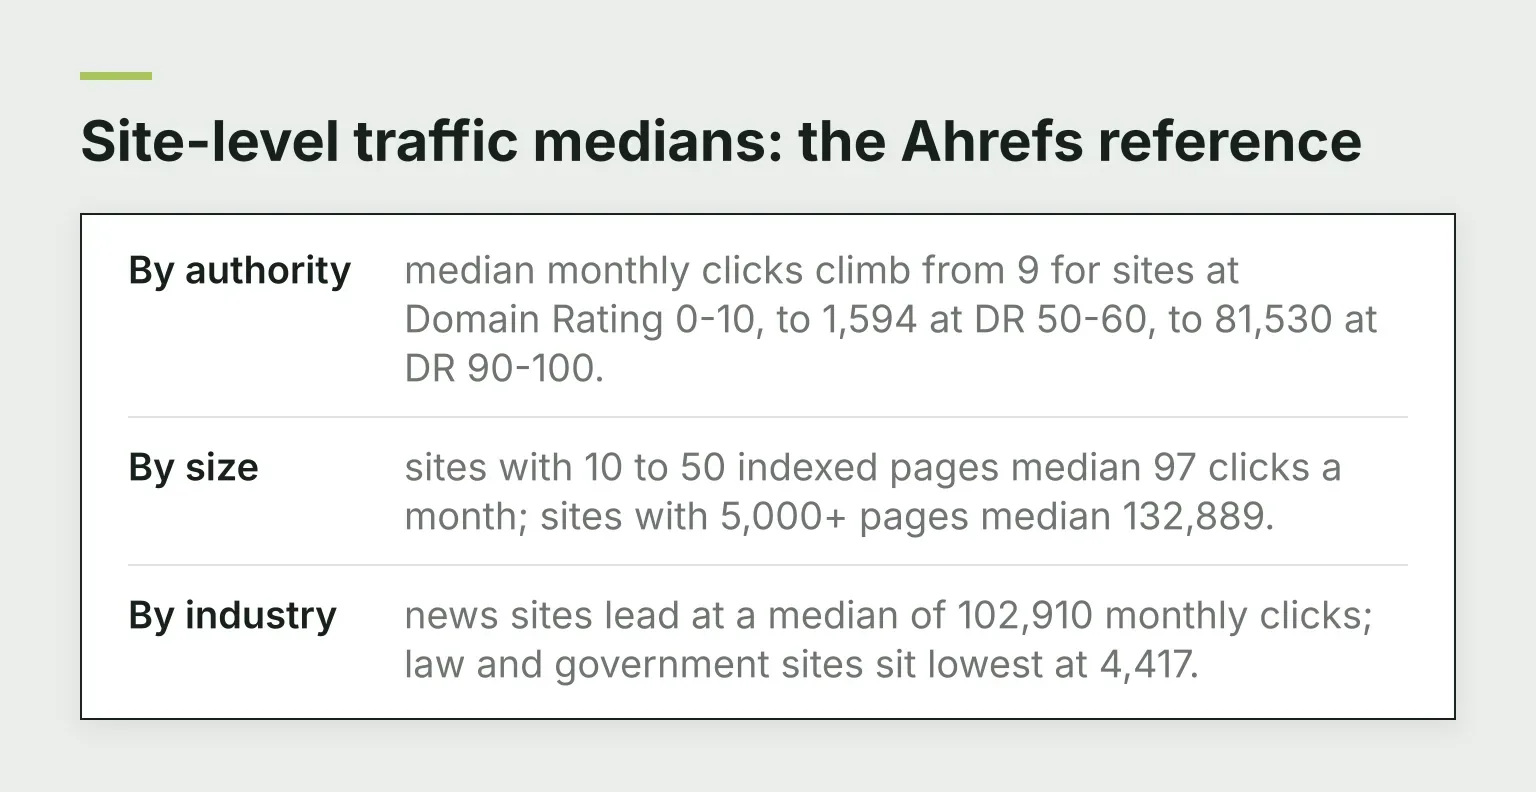
- By authority: median monthly clicks climb from 9 for sites at Domain Rating 0-10, to 1,594 at DR 50-60, to 81,530 at DR 90-100.
- By size: sites with 10 to 50 indexed pages median 97 clicks a month; sites with 5,000+ pages median 132,889.
- By industry: news sites lead at a median of 102,910 monthly clicks; law and government sites sit lowest at 4,417.
If you are under DR 30 and getting a few hundred organic clicks a month, the data says you are normal, not failing. Find your row by authority and size, then judge yourself against that, not against Amazon.
Build your own benchmark from Search Console first
Industry averages tell you where you might sit. Your own Search Console history tells you whether you are getting better or worse, which is the question that actually matters. The method is free and takes an afternoon:
- Pick a fixed window. Compare the last 90 days against the same 90 days a year earlier. Matching windows handle seasonality; floating "last 90 days vs prior 90 days" windows do not.
- Hold the filters constant. Same country, same device split, same search type (web) in both periods. Changing filters mid-comparison is the fastest way to invent a trend.
- Benchmark at the page level, not just the site level. Site-wide totals hide pages that quietly lost half their traffic under a growing average.
- Record clicks, impressions, and average position per page. Impressions falling with stable position means demand or SERP layout changed, not your page.
- Repeat the same comparison each quarter. A benchmark is only useful if the next measurement uses the same recipe.
Ahrefs' separate organic CTR benchmarks page is a good reality check here: across 422,421 sites, whole-site median CTR sits in the low single digits, far below the position-level numbers, because most impressions happen at lower positions. If your Search Console shows 2% site-wide CTR, that is normal, not broken.
This is also where RomeoSEO fits in. RomeoSEO reads your Search Console data and crawls your site to find keyword opportunities and pages that are losing traffic or rankings, then writes the fix. After a change goes live, it checks the page and watches whether it helped, and its Google stats page shows visitors from Google, impressions, and page-1 keywords over 28 days, 3 months, or 12 months. That keeps the watch-and-compare loop described above continuous instead of a quarterly scramble. It does not replace the method; it runs it for you.
Benchmarking against competitors: what tools can and cannot prove
Third-party tools estimate competitor visibility from click-stream panels, SERP sampling, and keyword databases. That is genuinely useful context, with two hard limits:
- They estimate. A tool saying a competitor gets 50,000 monthly organic visits is a model output, not a measurement. Your own Search Console numbers are first-party fact; theirs are not.
- They cannot see AI answer citations well. Most tooling still tracks organic positions, not who gets cited inside AI answers, which is now where a large share of clicks go.
Use competitor estimates to spot gaps and direction, never as proof of your own underperformance.
SEO benchmarking tools: a short comparison
If you searched for a "SEO benchmarking tool," here is the honest short version. No tool benchmarks for you; tools collect the data you benchmark with.
- Google Search Console is the first-party baseline. It is free, it is your real data, and every credible benchmark study leans on it. Start here.
- Bing Webmaster Tools gives you the same kind of first-party data for Bing, useful when your audience includes voice assistants or Microsoft surfaces.
- Ahrefs and Semrush are the main third-party suites for competitor visibility estimates, keyword gaps, and industry context. They estimate competitor traffic; they measure your data only through your own connected GSC or their crawls.
- DataForSEO sells raw SERP and keyword data via API, for teams that want to build custom benchmarking rather than buy a dashboard.
A fuller framework for choosing between them is in our guide to SEO analysis tools. The selection test for any benchmarking tool: does it give you first-party data, repeatable comparisons over time, competitor visibility without fake traffic claims, and clear documentation of its methodology?
Five benchmarking mistakes to avoid
- Comparing mismatched periods. Holiday quarter versus quiet quarter is not growth or decline, it is seasons.
- Letting site-wide averages hide page-level declines. Averaging a growing blog with a dying services page tells you nothing about either.
- Treating third-party estimates as proof. Your GSC is fact; their model is a model.
- Copying a CTR number without its settings. 7.1% and 39.8% were both true, in different SERP worlds.
- Benchmarking once. A benchmark is a recipe you repeat, not a screenshot you take.
The takeaway
Published benchmarks are useful for calibrating expectations, and dangerous for judging success. The 2026 numbers say: expect single-digit blended CTR even at position 1 on AI-answer queries, value top-5 positions far more than page-1 participation, treat industry growth tables as loose ranges, and always compare your own fixed windows in Search Console before you compare yourself to anyone else.
When you want that self-benchmarking running continuously, with slipping pages found and fixed from your connected Search Console data, RomeoSEO does exactly that. Start your free RomeoSEO trial to see it on your own site.